Kllyroo

Author name: kirshionline

Real-time cloud monitoring tool
Blog

8 Cloud Monitoring Tools to Keep Your Systems in Check

In today’s always-on digital world, downtime isn’t just inconvenient—it’s costly. Businesses rely heavily on cloud infrastructure for scalability, flexibility, and global reach. But without the right monitoring strategy, performance bottlenecks June 25, 2025 Abiya A 10:00 am Real-Time Cloud Monitoring Tools That DevOps Teams Trust In today’s always-on digital world, downtime isn’t just inconvenient—it’s costly. Businesses rely heavily on cloud infrastructure for scalability, flexibility, and global reach. But without the right monitoring strategy, performance bottlenecks, outages, or security threats can go unnoticed until it’s too late. This is where the best cloud monitoring tools play a critical role in ensuring system health and business continuity.  Cloud monitoring ensures your servers, apps, and infrastructure stay healthy and perform optimally. The best cloud monitoring tools like Kllyroo, Datadog, and New Relic offer real-time insights, alerting, and performance optimization for modern businesses. Choose tools that align with your tech stack, team size, and scalability goals.  Let’s explore eight reliable tools that provide visibility, control, and peace of mind when managing cloud-based environments.  Why Cloud Monitoring Matters Cloud monitoring involves tracking the performance, security, and availability of cloud resources—such as servers, databases, applications, and networks—in real time.  While its purpose may seem straightforward, its impact is massive. Efficient monitoring helps IT teams:  Detect and resolve issues proactively  Ensure compliance with service-level agreements (SLAs)  Optimize resource usage and costs  Maintain customer trust and uptime  Cloud-based infrastructure monitoring goes beyond just uptime checks. It also encompasses metrics analysis, log management, and incident response to offer full-stack visibility.  What are the three parts of cloud monitoring? Cloud monitoring typically includes:  Infrastructure Monitoring – Tracks CPU, memory, disk, and server availability  Application Monitoring – Ensures app performance and response times  Network Monitoring – Checks bandwidth, latency, and packet loss  Together, these give teams a 360° view of their cloud environment.  1. Kllyroo – End-to-End Monitoring for Modern DevOps If you’re looking for a comprehensive, real-time monitoring tool tailored for DevOps and IT teams, Kllyroo stands out.  Why Kllyroo?  Real-time insights across servers, logs, and applications  Simple setup with intuitive dashboards  24/7 monitoring without blind spots  Built for reliability and scalability  Unlike legacy platforms, Kllyroo is purpose-built for today’s cloud based infrastructure monitoring needs—ideal for fast-growing teams needing clarity and control.  “With Kllyroo, IT teams can stay ahead of server issues and resolve incidents before they impact users.”  Try Kllyroo free today and see the difference.  2. Datadog For enterprises seeking full-stack observability, Datadog offers an all-in-one monitoring and analytics platform. It provides deep visibility into applications, servers, databases, and even frontend performance. With AI-driven alerts and more than 500 integrations, it’s a go-to choice for complex, cloud-native systems.  3. New Relic New Relic delivers real-time insights into application and infrastructure performance. Its auto-instrumentation and user-friendly UI make it especially useful for teams aiming to improve user experience without writing custom code for every metric. The platform is also cost-effective for small to mid-sized teams with its usage-based pricing model.  4. Prometheus + Grafana If you’re looking for a customizable open-source solution, Prometheus combined with Grafana provides a powerful monitoring stack. Prometheus collects and stores time-series data, while Grafana visualizes it with highly customizable dashboards. This combo is ideal for DevOps teams that prefer hands-on control.  5. SolarWinds AppOptics AppOptics by SolarWinds is designed for developers and ops teams that want a simple yet powerful monitoring solution. It supports both cloud-native and hybrid environments and features automatic anomaly detection, detailed traces, and custom metrics for advanced observability.  6. LogicMonitor LogicMonitor offers agentless, SaaS-based infrastructure monitoring designed for scalability. It’s particularly effective for hybrid IT environments that span data centers, public cloud, and SaaS applications. With predictive alerts and automated device discovery, it reduces manual effort for IT teams.  7. Site24x7 Developed by Zoho, Site24x7 offers website, server, and cloud infrastructure monitoring with real user experience tracking. It’s favored by SMBs for its cost-effectiveness, easy integration, and comprehensive visibility across geographies and platforms.  8. Zabbix Zabbix is a trusted open-source solution known for its flexibility and enterprise-grade features. It enables organizations to monitor everything from servers to applications and services with fine-grained alerting and customizable configurations. Ideal for teams that want robust on-prem monitoring options.  Final Thoughts: Find the Right Fit for Your Cloud Stack Choosing the right monitoring tool isn’t about selecting the most popular—it’s about finding the best match for your system complexity, response needs, and budget. While tools like Datadog and New Relic offer enterprise-level functionality, platforms like Kllyroo deliver powerful cloud server monitoring tools with simplicity and agility.  Ready to take control of your infrastructure?  Start your free trial with Kllyroo and experience real-time, end-to-end monitoring built for your cloud future.  FAQ What is the best cloud monitoring tool in 2025? The best tool depends on your team’s size and goals. For real-time insights with simplicity, Kllyroo is a strong contender. For enterprise complexity, Datadog or New Relic may be more appropriate.  What is the purpose of cloud monitoring? Cloud monitoring ensures systems remain available, secure, and high-performing by providing visibility into infrastructure, applications, and user experience.  How does real-time monitoring help businesses? Real-time alerts enable IT teams to respond instantly to issues, minimizing downtime, preserving revenue, and maintaining user trust.  Social Share: Recent Blogs All Posts Blog 10 Must-Have Tools for End-to-End Monitoring in DevOps Teams July 9, 2025 In modern DevOps environments, visibility across the entire software lifecycle—from code commit to production—is essential. Teams can’t afford blind spots,… 12 Essential Features Every Server Monitoring Tool Must Have July 2, 2025 In a world where downtime is expensive and customers expect lightning-fast service, a solid server monitoring tool is no longer… Top 10 Server Monitoring Tools for 2025 June 25, 2025 In a world where downtime is expensive and customers expect lightning-fast service, a solid server monitoring tool is no longer…
Top DevOps monitoring tools comparison with Kllyroo, Datadog, Prometheus, and more
Blog

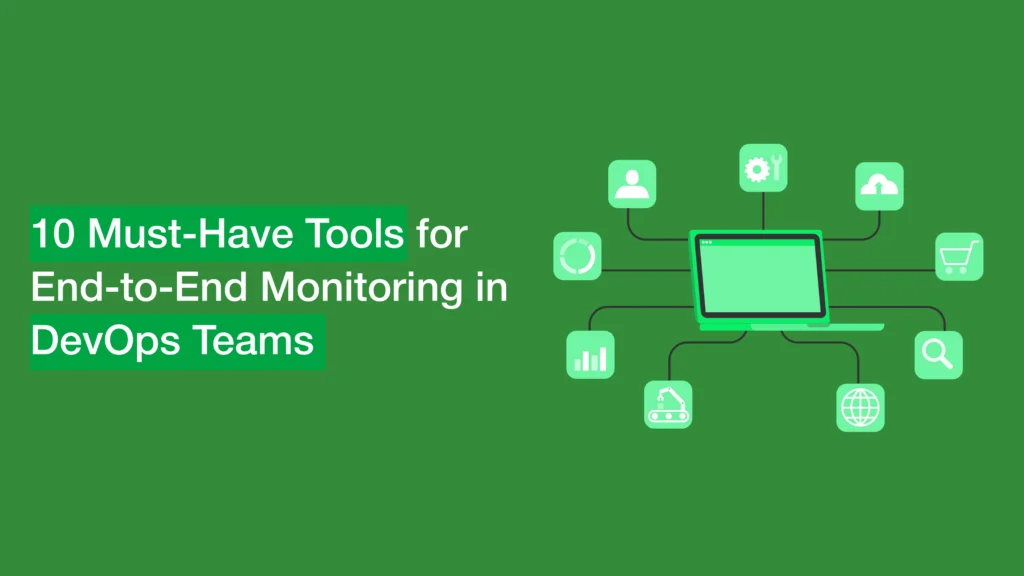
10 Must-Have Tools for End-to-End Monitoring in DevOps Teams

In modern DevOps environments, visibility across the entire software lifecycle—from code commit to production—is essential. Teams can’t afford blind spots, delays, or late incident detection. End-to-end monitoring is what keeps your systems fast, reliable, and secure.  July 9, 2025 Abiya A 10:00 am Essential DevOps Tools for Full-Stack Monitoring and Reliability In modern DevOps environments, visibility across the entire software lifecycle—from code commit to production—is essential. Teams can’t afford blind spots, delays, or late incident detection. End-to-end monitoring is what keeps your systems fast, reliable, and secure.  End-to-end monitoring in DevOps is the continuous tracking of infrastructure, applications, logs, and user experience across every phase of software delivery. It enables DevOps teams to detect issues early, reduce downtime, and ensure consistent performance.  Whether you’re optimizing microservices or managing distributed systems, selecting the best monitoring tool for DevOps is mission-critical.  Why Monitoring Matters in DevOps Workflows Monitoring is no longer an afterthought in DevOps—it’s a core responsibility. End-to-end responsibility means DevOps teams must track everything they deploy, from the infrastructure it runs on to how real users experience it.  This is where tools for continuous monitoring in DevOps become essential. They help teams:  Monitor application health  Track system usage and performance  Analyze logs and errors in real time  Gain visibility into CI/CD workflows  Platforms like Kllyroo are purpose-built to provide comprehensive, real-time monitoring tailored to modern DevOps workflows—ensuring both infrastructure and application layers are covered.  Top DevOps Monitoring Tools You Should Know Here are 10 top DevOps monitoring tools widely used by high-performing teams:  Tool  Primary Use  Why It Stands Out  Kllyroo  Full-stack monitoring & alerting  Unified dashboard, real-time insights, deep integrations  Datadog  Infrastructure & APM  Cloud-native observability, AI-driven alerts  Prometheus  Metrics & alerting  Open-source, ideal for Kubernetes  New Relic  Application performance  APM + logs + infrastructure in one  Grafana  Data visualization  Works with Prometheus and Loki  Splunk  Log analytics  Enterprise-scale log management  Dynatrace  AI-powered monitoring  Automatic discovery, deep observability  ELK Stack  Centralized logging  Elasticsearch + Logstash + Kibana  AppDynamics  APM for enterprises  Business transaction monitoring  Nagios  Legacy infrastructure monitoring  Plugin ecosystem, threshold alerting  Many teams combine several DevOps tools for monitoring based on infrastructure complexity and team maturity.  Types of Monitoring Tools in DevOps Different tools serve different layers of observability. Here are the major types of monitoring tools in DevOps:  Application Monitoring Tools in DevOps  Track application-level metrics, performance, errors, and traces. Examples: Kllyroo, New Relic, AppDynamics.  Infrastructure Monitoring  Monitor servers, containers, network health, and uptime. Examples: Prometheus, Nagios.  Log Monitoring and Aggregation  Centralize logs across systems for error tracking and audit trails. Examples: Kllyroo, ELK, Splunk.  User Experience Monitoring  Use synthetic testing or RUM to measure performance from the user’s point of view. Examples: Dynatrace, Kllyroo.  Application Performance Monitoring in DevOps Application performance monitoring in DevOps helps developers and operations teams understand how code behaves under real-world conditions. It involves tracking:  Response times  Error rates  Throughput  Real user interactions  Kllyroo offers end-to-end application performance monitoring, integrating directly with your CI/CD pipelines and microservices architecture. It provides distributed tracing, log correlation, and root-cause insights—all from a single pane of glass.  This helps teams ship faster, troubleshoot smarter, and optimize user experiences.  DevOps Logging and Monitoring: A Foundational Layer DevOps logging and monitoring provides context that metrics alone can’t. When alerts are triggered, logs often reveal the why.  Kllyroo simplifies log aggregation with structured indexing, real-time filtering, and alerting. It also correlates logs with application performance, helping teams reduce mean time to resolution (MTTR).  Logging tools aren’t just for error detection—they’re critical for security auditing, compliance, and proactive debugging.  Choosing the Best Monitoring Tool for DevOps: Key Considerations When selecting the best monitoring tool for DevOps, consider:  Full-Stack Coverage: Application + infrastructure + logs + UX  Ease of Use: Intuitive dashboards and customizable alerts  Integration: Connects easily with CI/CD, cloud, messaging platforms  Scalability: Grows with your infrastructure  AI & Automation: Anomaly detection, auto-baselining, predictive insights  Kllyroo checks all the boxes—offering powerful yet flexible monitoring capabilities built for modern DevOps and SRE teams.  Final Thoughts: Power DevOps Success with Kllyroo There’s no single tool that fits every team—but there are standout solutions that combine visibility, performance, and agility. If you’re building a stack of the top DevOps monitoring tools, ensure it covers infrastructure, application performance, logging, and user experience.  Kllyroo offers an all-in-one platform for real-time observability, designed for developers, SREs, and platform engineers. Whether you’re scaling cloud-native apps or troubleshooting legacy systems, Kllyroo empowers your DevOps team to stay ahead of outages and deliver exceptional performance.  FAQ What are the monitoring tools used in DevOps? Monitoring tools in DevOps include Kllyroo, Datadog, Prometheus, New Relic, and ELK Stack. These tools track infrastructure health, application performance, and logs to ensure system stability. What is end-to-end responsibility in DevOps? It means that DevOps teams are accountable not just for building and deploying code, but also for monitoring and maintaining system performance, reliability, and uptime post-release.  Which is the best monitoring tool for DevOps? The best tool depends on your team’s needs. Kllyroo stands out for its full-stack capabilities, real-time alerts, and deep integration with DevOps workflows.  Social Share:

Custom server alert settings in Kllyroo monitoring tool interface
Blog

12 Essential Features Every Server Monitoring Tool Must Have

In a world where downtime is expensive and customers expect lightning-fast service, a solid server monitoring tool is no longer optional—it’s essential. July 2, 2025 Abiya A 10:00 am Choosing the Right Server Monitoring Tool: 12 Features That Matter Most In a world where users expect instant access, every millisecond of server downtime matters. Whether you’re part of a lean DevOps team or managing enterprise-scale infrastructure, choosing the right server monitoring tool could be the smartest decision you make this year.  But what makes a tool right for your environment? We’ve broken it down into the 12 features you can’t afford to ignore—backed by real-world needs, not marketing fluff. What Is a Server Monitoring Tool (and Why It’s a Must-Have)? If you’ve ever had to troubleshoot a sluggish site, a CPU spike, or an unexpected outage at 2 AM, you already know the answer.  A server monitoring tool helps you track server health, performance, and uptime in real time. But more than that—it gives your team the visibility and control they need to act before problems escalate.  1. Real-Time Server Monitoring Monitoring without real-time data is just guesswork. When systems start misbehaving, you need to know right now, not after the damage is done.  Real-time server monitoring means you’re seeing live insights—CPU usage, memory overloads, traffic spikes—as they happen.  2. Server Performance Metrics That Make Sense Let’s be honest: staring at raw logs is exhausting. A great tool should visualize key server performance monitoring metrics like:  CPU load  Memory usage  Disk I/O  Network latency  At Kllyroo, you’ll find customizable dashboards that actually make sense—so even at a glance, you know where things stand.  3. Smart Alerts, Not Just More Noise What’s worse than no alerts? A flood of irrelevant ones. Your monitoring tool should alert you only when it matters.  Kllyroo’s smart alerting system cuts through the noise, prioritizing based on severity and letting you route them to Slack, Teams, or email.  4. Uptime Monitoring That’s Always Watching If uptime is your SLA, monitoring it is your insurance policy. Your tool should run background checks on all your critical services—24/7—reporting availability and downtime in real time.  5. Historical Trends & Patterns Knowing what happened is one thing. Knowing how often it happens? That’s real power.  With built-in trend analysis, you can identify recurring bottlenecks and preempt them. 6. Resource Usage Reporting That Actually Helps When servers lag, it’s often a capacity issue. A capable monitoring solution shows you who (or what) is hogging your resources—CPU, RAM, or bandwidth—before downtime hits.  7. Root Cause Analysis Without the Manual Digging Fixing the symptoms is quick. Fixing the cause? That’s smart. Your tool should help you trace problems back to their source: bad deploys, faulty scripts, or rogue processes.  8. Designed to Scale With You Whether you’re monitoring 5 servers or 500, your tool should grow with you.  Kllyroo is built for scale—from startups to enterprises, hybrid to multi-cloud.  9. Thresholds You Can Actually Control Every environment is different. You should be able to set thresholds based on your actual load patterns—not some arbitrary default.  10. Works Across Platforms Whether you’re running Linux, Windows, or a hybrid environment with AWS and Azure, your monitoring should cover all of it—without juggling tools. 11. Plays Well With Your Stack Already using Slack, Jira, PagerDuty, or Prometheus? Great. Kllyroo integrates easily with your existing DevOps toolkit—because new tools should reduce complexity, not add to it.  12. Security & Role-Based Access Your monitoring dashboard holds sensitive data. Role-based access, audit logs, and encrypted data handling aren’t extras—they’re essentials.  Feature Snapshot: What to Look For Must-Have Feature  Why It Matters  Real-time Monitoring  Detect issues instantly  Server Performance Metrics  Diagnose problems faster  Smart Alerting  Reduce alert fatigue  Uptime Tracking  Ensure consistent service  RCA & Integrations  Faster resolution, seamless workflows  Why It All Matters: Your Infrastructure Deserves Better The purpose of a monitoring and management server isn’t just to gather data—it’s to make data actionable. And the best server monitoring tools for DevOps don’t just tell you what’s broken; they help you fix it faster.  At Kllyroo, we’ve built a monitoring platform for teams that can’t afford to slow down. It’s lightweight, real-time, and actually enjoyable to use.  Final Thoughts If you’re still running blind—or worse, reacting too late—maybe it’s time for a change. Kllyroo gives you clarity, speed, and control over your servers—without the bloat.   Try Kllyroo for free and monitor what matters.  FAQ What’s the purpose of a system monitoring tool? To keep your servers healthy, your infrastructure reliable, and your teams informed—before things break, not after.  Which monitoring tool is best? The best one is the one that fits your team, your stack, and your goals. Kllyroo is built for modern DevOps workflows, so it’s lightweight, fast, and incredibly easy to adopt.  How does real-time server monitoring reduce downtime? By alerting your team instantly when performance issues arise, real-time server monitoring helps you respond before users are impacted—minimizing downtime.  Social Share:

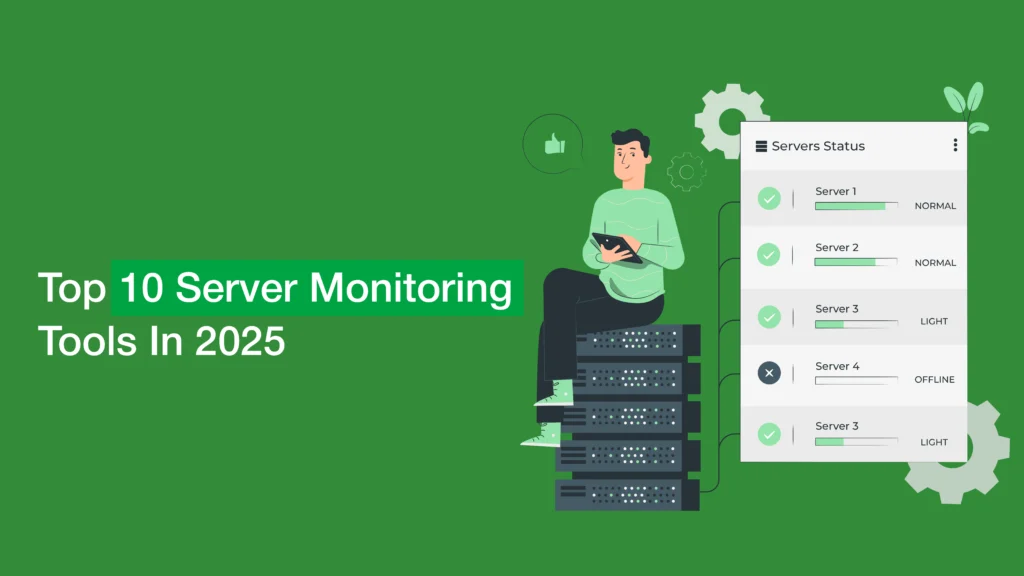
Top 10 server monitoring tools for 2025 compared by features and performance
Blog

Top 10 Server Monitoring Tools for 2025

In a world where downtime is expensive and customers expect lightning-fast service, a solid server monitoring tool is no longer optional—it’s essential. June 25, 2025 Abiya A 10:00 am Best Server Monitoring Tools in 2025: Find the Right Fit for Your Team In a world where downtime is expensive and customers expect lightning-fast service, a solid server monitoring tool is no longer optional—it’s essential.  Whether you’re a startup scaling fast or an enterprise juggling complex systems, having real-time visibility over your servers can mean the difference between smooth sailing and a flood of support tickets.  So, which platforms are worth your time in 2025? We’ve rounded up the best server monitoring tools that are making waves this year—ranked and reviewed so you can find the perfect fit.  1. Datadog Best for: Cloud-native teams with high data complexity  Datadog is the power tool of the bunch. With seamless integrations, real-time dashboards, and predictive alerts, it’s the gold standard for many DevOps teams. If you’re running distributed services or want one pane of glass to monitor everything, this server monitoring tool has you covered.  2. Zabbix Best for: Custom solutions and open-source flexibility  Zabbix is fully open-source and feature-rich. It gives you complete control over what and how you monitor, making it ideal for sysadmins who like to fine-tune their systems. There’s a learning curve, but once you’re set up, it runs like a charm.  3. Nagios XI Best for: Tried-and-tested monitoring simplicity  Nagios has been a go-to server monitoring tool for years—and it still holds up. With straightforward health checks, notifications, and uptime monitoring, it’s perfect for smaller teams or traditional setups that need consistency.  4. Kllyroo Best for: Fast-paced teams that want simplicity with depth  Kllyroo might be new, but it’s turning heads. It rolls everything into one tool—Uptime Monitoring, Cloud Monitoring, Error Tracking, Logs, and even Auto Scaling Metrics—without overcomplicating things.  If you’re tired of jumping between tools to get the full picture, Kllyroo delivers a seamless experience that punches above its weight. It’s one of the best server monitoring tools to watch in 2025.  5. SolarWinds Server & Application Monitor Best for: Hybrid and Windows environments  SolarWinds remains a staple in IT circles. It offers deep insights into Windows servers and applications, backed by years of industry use. If you’re running legacy infrastructure alongside modern systems, this one makes the transition easier.  6. New Relic Best for: Performance-focused dev teams  More than just a server monitoring tool, New Relic ties server health to application performance. You’ll get detailed traces, metrics, and AI-powered insights, all in a sleek interface. It’s ideal for teams who need to debug fast and deploy faster.  7. Prometheus + Grafana Best for: Custom dashboards and DIY monitoring  This dynamic duo is favored by engineers who like full control. Prometheus handles the metrics, while Grafana makes them look good. The setup takes effort, but once it’s live, you’re working with one of the best server monitoring tools for real-time visibility.  8. Uptime Robot Best for: Simple uptime checks and small teams  If you just want to know when something goes down, Uptime Robot is refreshingly simple. It pings your services every 5 minutes and lets you know if something breaks. That’s it. No bells, no whistles—just reliability.  9. Icinga Best for: Monitoring mixed infrastructures  Icinga is sleek and fast, with strong visualization features and scalable architecture. It’s a modern spin on Nagios with added flexibility—ideal for teams working with both on-prem and cloud services.  10. ManageEngine OpManager Best for: Small businesses with growing needs  ManageEngine blends server and network monitoring into one accessible platform. It’s affordable, comes with plenty of templates, and doesn’t overwhelm you with complexity. A strong contender for teams that are just getting serious about monitoring. Final Thoughts: Choose What Fits, Not What’s Popular Finding the right server monitoring tool isn’t about chasing the latest name—it’s about understanding what fits your system, team, and workflow.  Here’s what to look for:  Instant alerting  Easy-to-read dashboards  Cloud + on-prem support  Detailed logs and metrics  Scalable infrastructure coverage  If you’re in the market this year, platforms like Kllyroo prove that the next generation of best server monitoring tools is all about doing more—with less complexity.  Want Peace of Mind? Start Monitoring Smart. It’s not about watching every blip—it’s about knowing when something needs your attention. The right server monitoring tool brings calm to chaos, clarity to performance, and time back to your team.  Try one. Compare a few. But above all—start monitoring smarter in 2025. FAQ Why is Kllyroo considered a top server monitoring tool in 2025? Kllyroo offers real-time monitoring, uptime checks, error tracking, and cloud metrics in one tool—ideal for modern DevOps teams.  Is Kllyroo suitable for startups? Yes, it’s lightweight, easy to use, and powerful enough for fast-growing teams needing reliable server monitoring.  Can Kllyroo replace other monitoring tools? Yes. It combines uptime, logs, metrics, and scaling insights—eliminating the need for multiple tools. Social Share:

Right Server Monitoring Tool
Blog

How to Choose the Right Server Monitoring Tool: A 6-Step Checklist

Let’s face it: servers are the unsung heroes of your digital business. When they’re happy, everything works. When they’re not—you hear about it. Fast. June 21, 2025 Abiya A 10:00 am Keeping Tabs on Your Servers Just Got Simpler Let’s face it: servers are the unsung heroes of your digital business. When they’re happy, everything works. When they’re not—you hear about it. Fast.  That’s why having the right server monitoring tool isn’t just a nice-to-have—it’s critical. But the tricky part? Figuring out which tool actually fits your setup (and doesn’t make your team want to scream).  We’ve put together a simple, no-jargon checklist to help you sort through the noise and pick a tool that’s not just powerful, but also makes your day easier. Along the way, we’ll introduce you to Kllyroo, a rising star in the monitoring world that’s turning heads for the right reasons.  1. Start With What You Actually Need (Not Just What’s Trending) Before you even Google “best server monitoring tools,” pause. Think about your own infrastructure first.  Are you mostly cloud-based? Running hybrid systems? Need to track uptime, errors, or deep performance stats?  Your setup, goals, and team size will all influence what kind of monitoring solution makes sense. For instance, Kllyroo is lightweight but surprisingly deep—it’s built to scale with your growth and keeps things super clear even if you’re not a full-blown DevOps pro.  2. Look for the Features That Actually Save You Headaches You don’t need all the bells and whistles. Just the right ones. Here’s a short list of features worth having on your radar:  Uptime Monitoring – so you know the moment your server sneezes  Application Performance – to catch what’s slowing down your app  Cloud & Resource Monitoring – keep tabs on cost and usage  Error Monitoring – track crashes, bugs, and weird behavior  Auto Scaling Metrics – super useful if you’re working in containers or cloud-native apps  System Metrics – CPU, memory, disk—you want the full picture  Logs & Alert Monitoring – so you’re not digging through chaos at 3AM  Service Monitoring – great for multi-layered apps with lots of moving parts  Most solid tools today offer some combo of these, but the way they present the data makes all the difference. Kllyroo, for instance, takes a clean, no-fluff approach that gives you what you need—without drowning you in graphs.  3. Make Sure It Plays Nice With the Rest of Your Stack A good server monitoring tool should blend into your workflow like it was always there. If you’re constantly switching windows or copy-pasting alerts into Slack, something’s off.  The best tools integrate with your cloud provider (AWS, Azure, GCP), CI/CD tools, and your team’s favorite comms apps. Kllyroo does this well—especially for teams that want plug-and-play setups without tons of configuration.  4. Don’t Underestimate the Power of a Good Interface Tech is complex. Your monitoring dashboard doesn’t have to be.  If the tool you choose makes you click 5 times just to check CPU load, it’s going to slow your team down. Look for tools that offer:  Clean, intuitive dashboards  Role-based views (so everyone sees what they need)  Mobile-friendly access for quick checks on the go  We’ve seen users gravitate toward Kllyroo simply because it’s not overwhelming—it feels like it was designed by someone who’s actually managed live servers at 2AM.  5. Plan for Growth, Not Just Today Today you might be monitoring 10 servers. Six months from now? That could triple.  You need a solution that doesn’t buckle under pressure—or charge you a fortune when your traffic spikes. The best server monitoring tools scale effortlessly, both technically and in terms of pricing.  Kllyroo gets this right. It grows with your environment and doesn’t nickel-and-dime you for every new microservice you add.  6. Don’t Just Look at Price—Look at What You Get Back It’s tempting to pick the cheapest option. But think of it this way: how much does an hour of downtime cost your business? Exactly.  A smart server monitoring tool doesn’t just show you problems—it helps you avoid them altogether. Tools that surface actionable insights, reduce false alarms, and give your team confidence are worth every penny.  Kllyroo isn’t bloated or overly expensive—it’s designed to deliver real value, especially for teams that need clarity fast and can’t afford to waste time figuring out what went wrong.  Final Thoughts: Simplify Monitoring, Amplify Peace of Mind Choosing the right server monitoring tool shouldn’t feel like rocket science. If you focus on what really matters—ease of use, useful features, scalability, and smart alerts—you’ll find a platform that doesn’t just monitor your servers, but empowers your team.  Whether you go with a well-known name or something fresh like Kllyroo, trust your instincts, test it hands-on, and choose the tool that feels like a natural extension of your workflow. Try Kllyroo free—book a quick demo and discover a smarter way to monitor your servers.  Social Share:

Scroll to Top